How-to: Data Visualization Lets You See Data Clearer and Faster

In just about every facet of business today, we are faced with large amounts of data. Visualization of that data can increase our ability to process information exponentially. In fact, according to research conducted by 3M, we process visual data 60,000 times faster than text.
Data visualization is especially important for digital marketers. Think about the vast volume of information that a single digital marketing campaign can yield; thousands of data points covering everything from where customers are located to which devices they are on and the channel they are using when they convert. Digital marketers are faced with the challenge of analyzing this data to optimize their campaign spending. Fortunately, there is advanced marketing campaign tracking software that can help with this task.
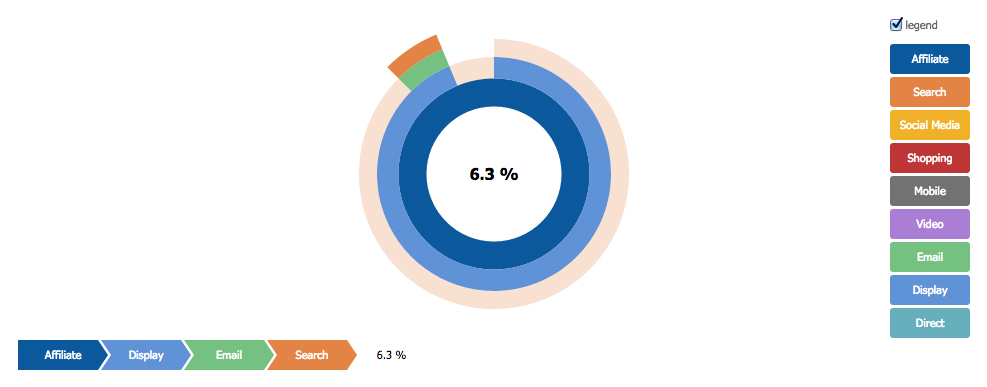
This sunburst visualization allows marketers to quickly see the paths their customers follow to conversion.
When deciding on the right tracking software, marketers need to keep in mind that a solid solution should provide data visualizations that are based on real-time data, display the most important KPIs in a single location, and organize and display data any way they’d like – even on mobile devices.
Real-time Data: Marketers need to conduct data analysis quickly to react to real-time market conditions. Reacting too slowly can cost sales and reduce revenue. Rather than looking at raw data sets, marketers can react more quickly when that data is presented to them as real-time data visualizations.
Important KPIs: Marketers should also have the ability to view all of the key performance indicators – traffic sources, return on investment, cost per lead, etc. – that are important to their business in a single location. This will give them a solid understanding of the performance of their marketing campaigns and allow them to redirect their marketing spend to the channels that are performing best. Marketers can unfortunately miss out on opportunities if they are spending too much time compiling data from different sources.
Data Flexibility: A good marketing campaign tracking solution should also provide the flexibility to organize and view data in the manner that best fits the marketer’s needs. This flexibility should also translate to the solution’s data visualizations. With the proper software solution, marketers can save countless hours previously spent analyzing data and put that time towards growing their business. Additionally, a comprehensive solution should free marketers from their desktops or laptops by being available 24/7 on mobile devices.
For any business, certain key pieces of data will consistently be the most important to success. By analyzing this data in a comprehensible manner through the use of visualizations, the true meaning of the data can be recognized in a matter of seconds. The most important thing to remember when finding a solution is that its data visualizations should eliminate information overload, leaving marketers with the insight to make intelligent business decisions.
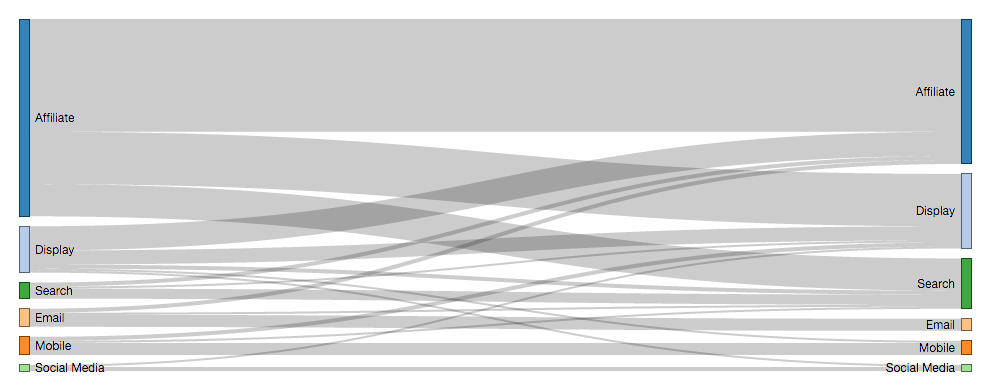
This sankey visualization lets marketers easily make sense of the complex relationship between marketing channels. The left side indicates the customer’s first touch and the right side indicates the source of their final conversion. This visualization makes it easy to see in seconds which channel is the top performer as the first touch with the customer as well as the portion of those first touches that convert in a different channel.