Unveiling CAKE Insights: Where Advanced Reporting Meets Powerful Visualizations
At CAKE, we’re big believers that the value of data is undeniable. It can reveal insights, fuel decision-making, and deliver a competitive advantage. You probably agree. Yet, being able to put your data to work with reporting and visualizations has often proven to be easier said than done.
That’s why we’re excited to introduce CAKE Insights.
The new solution provides more advanced, more insightful, and more user-friendly reporting, visualizations, and dashboards that meet the diverse needs of our users.
Customers are running billions of transactions through CAKE each month. By automating the process of aggregating and visualizing large amounts of data, CAKE Insights enables affiliate networks, as well as lead generators and aggregators, to quickly and easily understand trends, patterns, and key performance indicators (KPIs) that matter.
We’ve worked with thousands of affiliate marketers and recognize that no two customers are exactly the same, so data needs to be organized and visualized differently for the biggest impact.
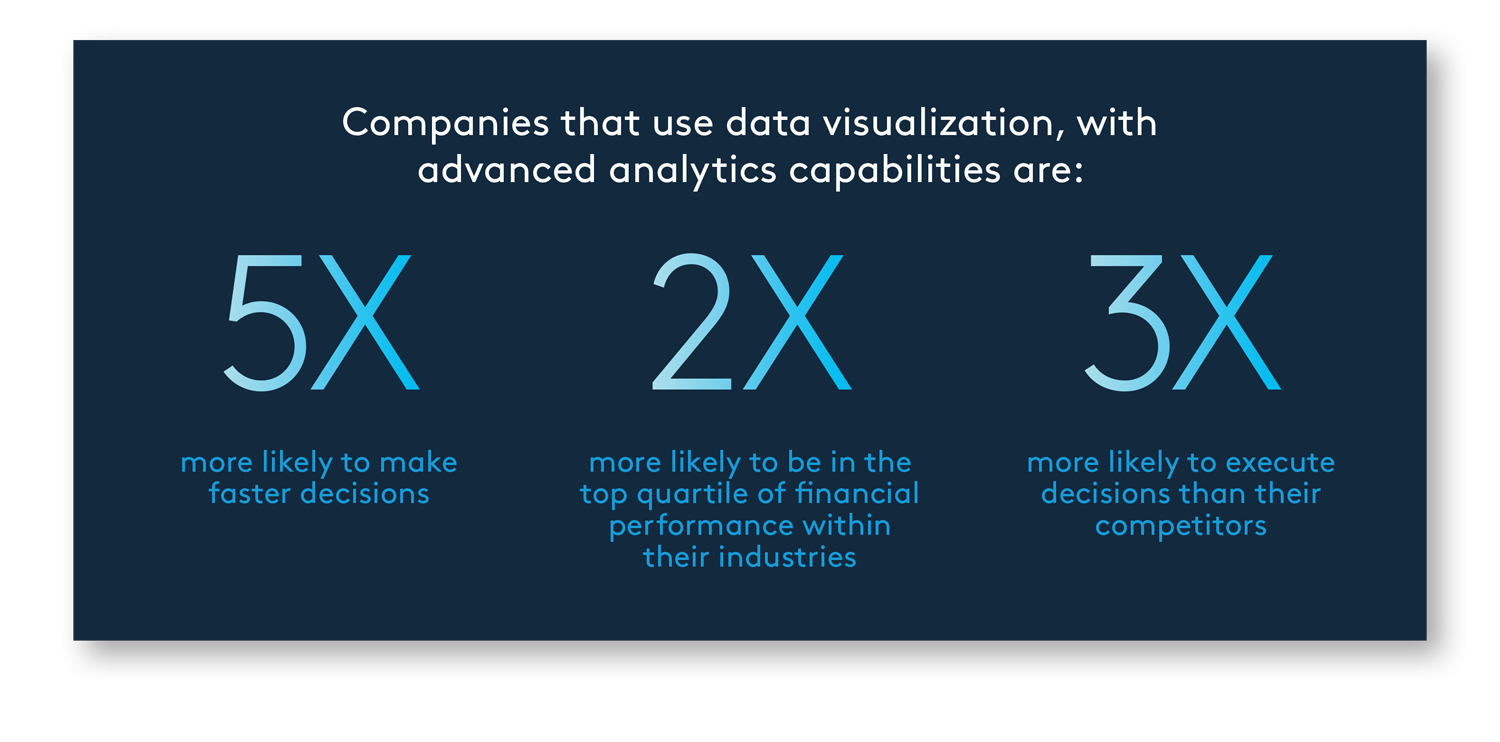
Why visualizations matter
When reporting and visualizations are limited, marketers are prohibited from viewing and applying data insights that can be crucial for running successful performance marketing campaigns.
Because of these limitations, performance marketers have turned to resource- and time-consuming methods to access the insights they require. These range from exporting data from their tracking platform and manually manipulating it in spreadsheets; to utilizing APIs to export data and sync the changes with their BI platforms, such as Tableau and Power BI. Then on top of this, some marketers are paying a visualization expert to create KPI dashboards.
How CAKE Insights works
CAKE Insights empowers performance marketers with seamless access to powerful insights that drive revenue growth.
Here are more details about the value and capabilities available through CAKE Insights.
Boost efficiency
The benefits of automating the process of collecting and visualizing data increases efficiency, consistency, and accuracy, with the potential to reduce costs. By eliminating manual reporting processes, CAKE Insights enables you to optimize operations and quickly access valuable data within the platform.
Users get up-to-date reporting and price adjustments with automatic syncing across tracking and reporting, device, traffic caps, and fraud detection. For instance, reports from CAKE Insights can be used to detect fraud in an affiliate marketing program. By analyzing up-to-date data – such as click patterns and conversion rates – you can identify suspicious activity and take immediate action.
Unlock the power of data
CAKE Insights simplifies the process of filtering and grouping large data sets according to your preferences and gaining clarity with insights that drive campaign success.
For example, you can filter, search, use partial string matches, and multi-select entities such as vertical, advertiser, affiliate, offer, and Sub ID 1.
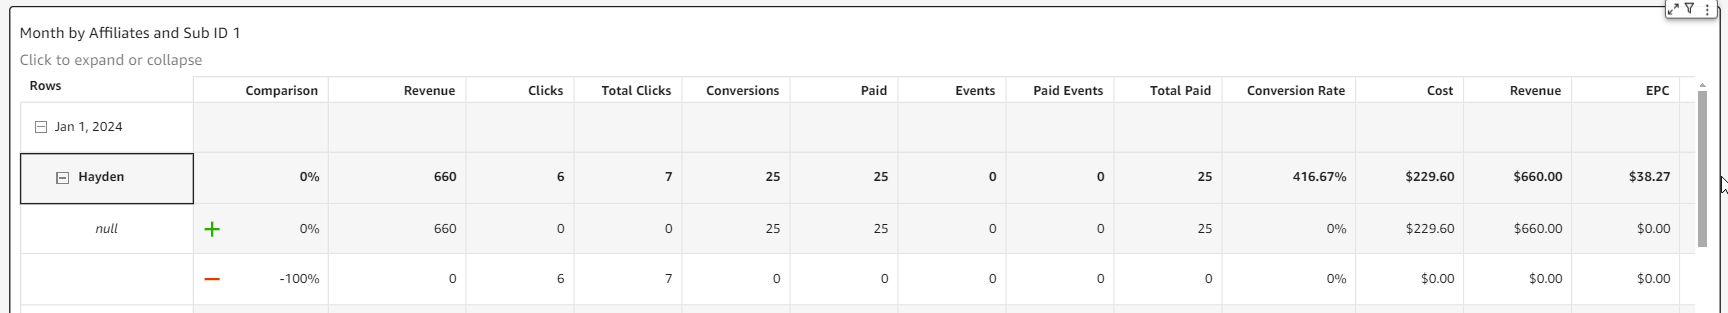
You can also organize and summarize data based on your preferences by dynamically grouping entities including advertisers, affiliates, campaigns, creatives, offer contracts, offers, Sub ID 1, and verticals. Furthermore, you can access reporting on click- and conversion-centric KPIs – such as CTR, CPC, CPA, and conversion rate – and group by any dimension.
Make intelligent marketing decisions
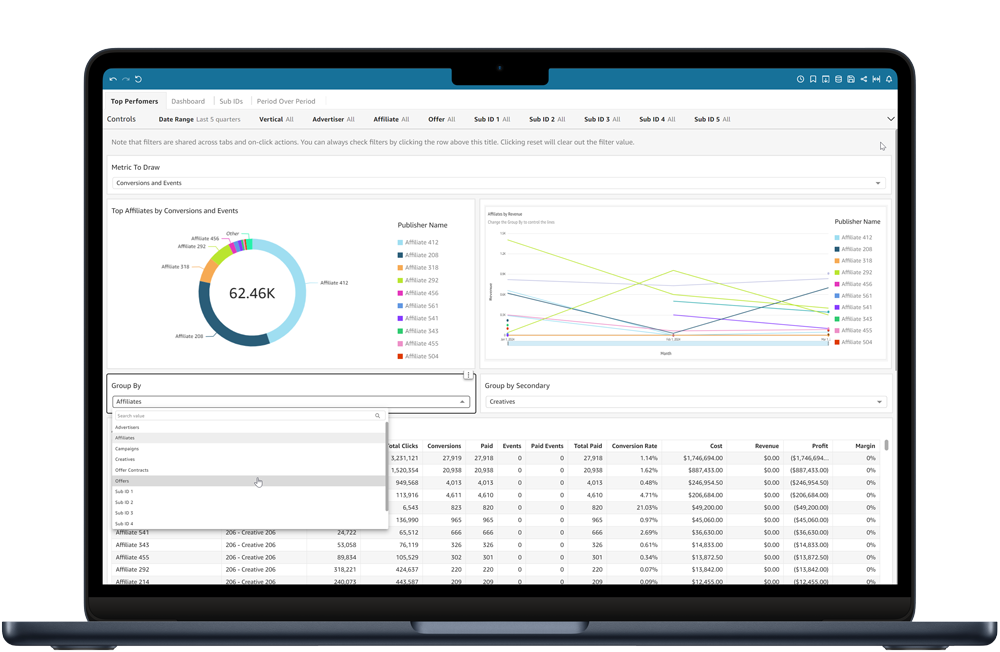
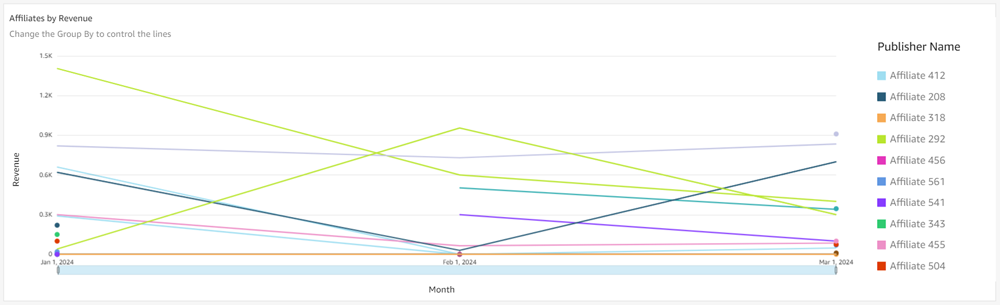
With CAKE Insights, your strategic oversight is enhanced with advanced dashboards and hundreds of variations of data visualizations. These include pie charts, line graphs, and tables to see your data how you want, all in one place, making it easy to identify the insights that facilitate data-driven decision making.
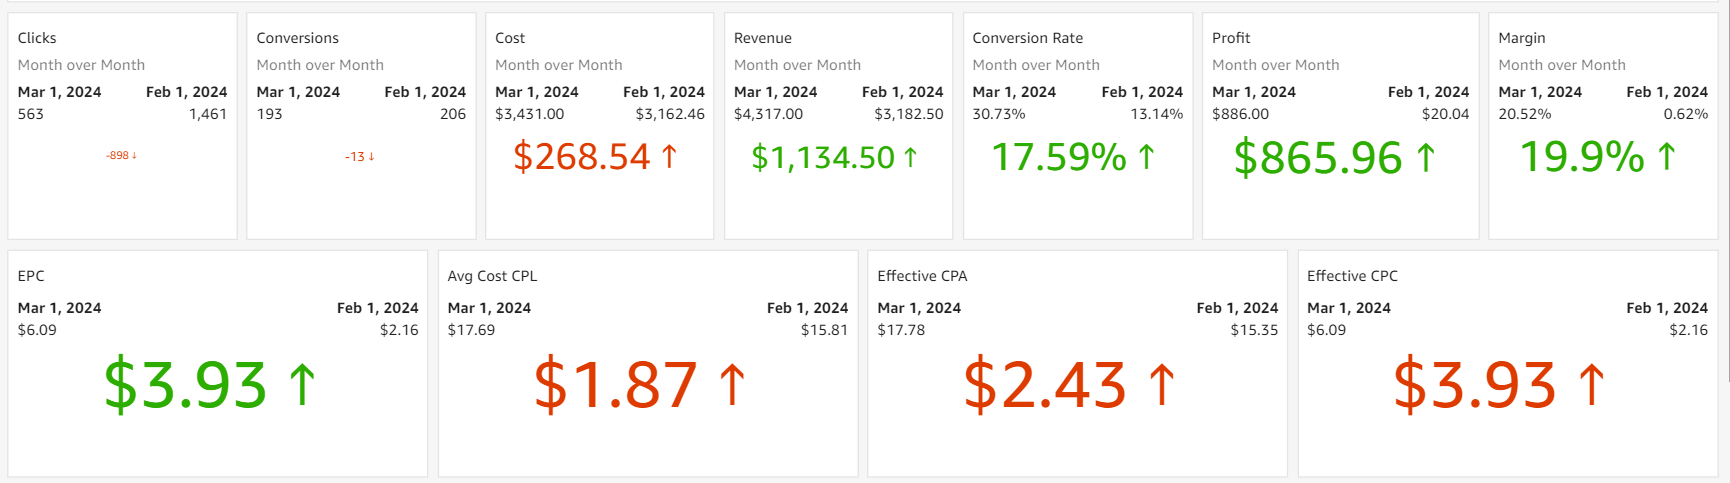
A few features to highlight are the “metric to draw” capability that allows users to select a metric and turn that one selection into various visualizations. Additionally, tabs provide multiple views of dashboards to easily visualize data by top performers, KPIs, etc. There is also “period-over-period” reporting, which enables users to choose the appropriate aggregation period based on their specific reporting and analysis goals. For example, when examining short-term fluctuations in traffic, using the day or week aggregation might work best. On the other hand, when analyzing annual revenue trends or long-term marketing performance, aggregating by month, quarter, or year may be more appropriate.
Elevating the data experience with advanced reporting and visualizations
Now we’re just getting started. CAKE Insights will continue to evolve, forwarding the potential of reporting, dashboards, and visualizations that enable you to discover new insights with ease.
Are you a customer interested in getting started with CAKE Insights? Reach out to our team here.